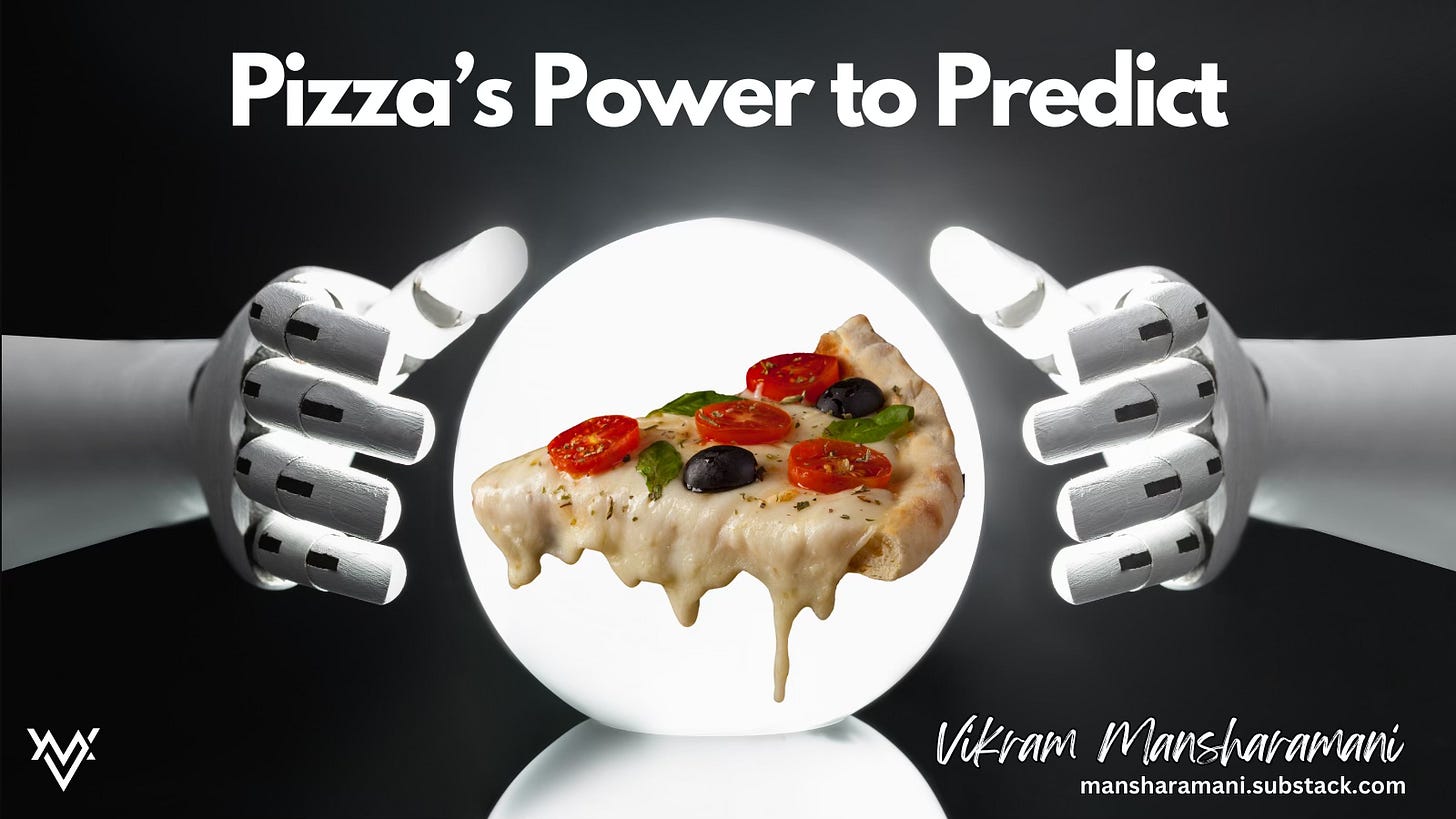
Pizza's Power to Predict
Does the Pentagon Pizza Index telegraph global chaos?
Recently, I’ve been intensely focused on all things pizza – a natural consequence of my having recently started a frozen pizza manufacturing business. Pizza news, the pizza market, anything affecting the pizza ingredient supply chain…all grab my attention. And I always detour to the frozen section of any grocery store to see the offerings, placement, and pricing of the pizza products they offer. But I also continue to monitor the context in which the pizza industry operates—and regularly watch Sunday morning news shows, skim about 5 newspapers each day, and religiously listen to Bloomberg News.
Given my long-standing interest in foreign affairs, geopolitics, and economics, it should be no surprise that a recent headline about the “Pentagon Pizza Index” caught my attention. The index, which tracks pizza orders heading to the headquarters of the US Department of Defense from local pizza shops, tends to surge immediately before geopolitical or military events transpire. Why’s that? When the world is on the cusp of major events, those working at the Pentagon usually work late and order pizza.
The Pentagon Pizza Index recently started trending on social media. Why? There’s a Twitter account called “Pentagon Pizza Report” that uses open source data to monitor pizza activity near the Pentagon (Virginia, headquarters for the US Department of Defense), MacDill AirForce Base (Tampa, headquarters for US Special Operations Command and Central Command), the White House, and other locations. On June 11, @PenPizzaReport posted that pizza activity had spiked near the Pentagon. Israel attacked Iran the very next day.
Although this was the first I had heard of it, the idea has been kicking around for decades. It might be apocryphal, but the story goes that the practice was started by Soviet spies in 1980’s, who watched pizza delivery cars in the Washington, DC area; they dubbed it “Pizzint”. And news reports at the time also noted that deliveries picked up before the U.S. invasion of Grenada in 1983 and Panama in 1989.
But it wasn’t until the 1990’s that idea really took off, when pizza deliveries seemingly predicted the start of the First Gulf War. Frank Meeks, who at the time owned 43 Domino’s franchises in the Greater DC area, noted that late night pizza deliveries to the Pentagon had increased from three to over one hundred; 55 pizzas had been delivered to the White House, and 21 to the CIA the night before the war started. This led CNN’s Wolf Blitzer to remark at the time, “Bottomline for journalists: Always monitor the pizzas.”
Wolf Blitzer: “Always monitor the pizzas”
Those who have followed my work for some time won’t be surprised that this story appealed to me. I have long suggested that the best way to navigate uncertainty is to embrace a generalist approach: focus on connecting dots across silos, look for relationships between seemingly irrelevant domains, and think about multiple futures.
For example, shortly after the financial crisis, while teaching a class about financial bubbles at Yale, I decided to investigate if it were possible to identify financial bubbles before they burst and to see if I might be able to identify signs that reflected underlying exuberance. My research revealed that two seemingly irrelevant indicators appeared to do exactly that: the world’s tallest skyscrapers, and the share price of auction house Sotheby’s common stock (it was publicly traded back then).
I wrote an article in 2011 about the world’s tallest skyscrapers being a reliable indicator of bubbles. When skyscrapers are built, they are usually built on faith; tenants aren’t lined up and it’s unclear if there will be enough future occupants to fill the space. Skyscraper construction tends to be speculative. Skyscrapers are also built using credit; the amount of money entailed forgoes the possibility of self-financing. Skyscraper construction usually indicates banks are confident and flush; money is easy to get. And when decisions are made to build the tallest skyscraper ever, it usually indicates irrational exuberance or chest-thumping overconfidence. As I described in Boombustology, my 2011 book about bubbles, the world’s tallest skyscrapers predicted the Great Depression, the Asian Financial Crisis, the Technology Bubble of 1999/2000, and the Global Financial Crisis.
Skyscrapers Are A Great Bubble Indicator
One of the first skyscrapers was designed and built by Bradford Lee Gilbert in 1887. It was designed to solve a problem of extremely limited space resulting from the ownership of an awkwardly shaped …
I also wrote a piece on another bubble indicator: Sotheby’s stock price hitting relative highs. When Sotheby’s was doing especially well it was a result of the higher and higher prices being commanded at its auctions. The dynamics at play here are similar to those associated with skyscrapers. People with a lot of money are making a speculative play that the prices they are paying at an auction will be surpassed by the prices commanded at future auctions. Overconfidence and easy money drive auction prices and Sothebys revenues (and skyscrapers) sky-high. I’ve noted how Sotheby’s stock price hit new highs in 1989 (driven by Japanese buyers), 1999 (driven by tech executives buying art), and 2007 (driven by private equity managers)… telegraphing the Japanese bubble, DotCom bubble, and the Global Financial Crisis.
Sotheby’s Stock Price: The World’s Best Overconfidence Indicator?
Anyone who has witnessed a live auction in which bidding far exceeds pre-auction estimates or sets a new world record price understands there is something curious in the air. There is something elect…
My fascination with bubbles grew with time and I expanded my focus from navigating financial bubbles to navigating uncertainty more generally. I found that connecting seemingly irrelevant dots was really useful in many areas outside of investing. I’ve written about how crossing silos can help in healthcare, intelligence, and education. I learned that those who focused narrowly on one industry or function had an excellent ability to provide insight to those looking elsewhere.
Are all of these things mere coincidences? When it comes to the Pentagon Pizza Index, that’s exactly what the Pentagon would have us believe, and it strenuously denies the connection (of course). But other observers are convinced; Alex Selby-Boothroyd, The Economist’s head of data journalism, posted on LinkedIn that it was a “surprisingly reliable predictor of seismic global events.”
Personally, I do believe skyscrapers and auctions – among other things - are reliable indicators of bubbles. When it comes to pizza deliveries predicting world events, it’s unclear if the indicator is still useful— after all, Uber Eats has grown the universe of food delivery options beyond just pizza. While the Pentagon Pizza Index may be an uncertain indicator, I can tell you with certainty that the Goodwell Team is regularly fueled by our delicious pizzas, and late nights always see a spike.
VIKRAM MANSHARAMANI is an entrepreneur, consultant, scholar, neighbor, husband, father, volunteer, and professional generalist who thinks in multiple-dimensions and looks beyond the short-term. Self-taught to think around corners and connect original dots, he spends his time speaking with global leaders in business, government, academia, and journalism. He’s currently the Chairman and CEO of Goodwell Foods, a manufacturer of private label frozen pizza. LinkedIn has twice listed him as its #1 Top Voice in Money & Finance, and Worth profiled him as one of the 100 Most Powerful People in Global Finance. Vikram earned a PhD From MIT, has taught at Yale and Harvard, and is the author of three books, The Making of a Generalist: An Independent Thinker Finds Unconventional Success in an Uncertain World, Think for Yourself: Restoring Common Sense in an Age of Experts and Artificial Intelligence and Boombustology: Spotting Financial Bubbles Before They Burst. Vikram lives in Lincoln, New Hampshire with his wife and two children, where they can usually be found hiking or skiing.


